Interview! Intertwining the world of Volume/Price (Technicals) and Value (Fundamentals)
Check out this interview to see how practitioners think and more importantly which suits you better

Intro -
In the investing world, the Technical Analysis vs Fundamental Analysis debate has been running for decades. Very often, investors used to pick a side and then defend why it’s better than the other.
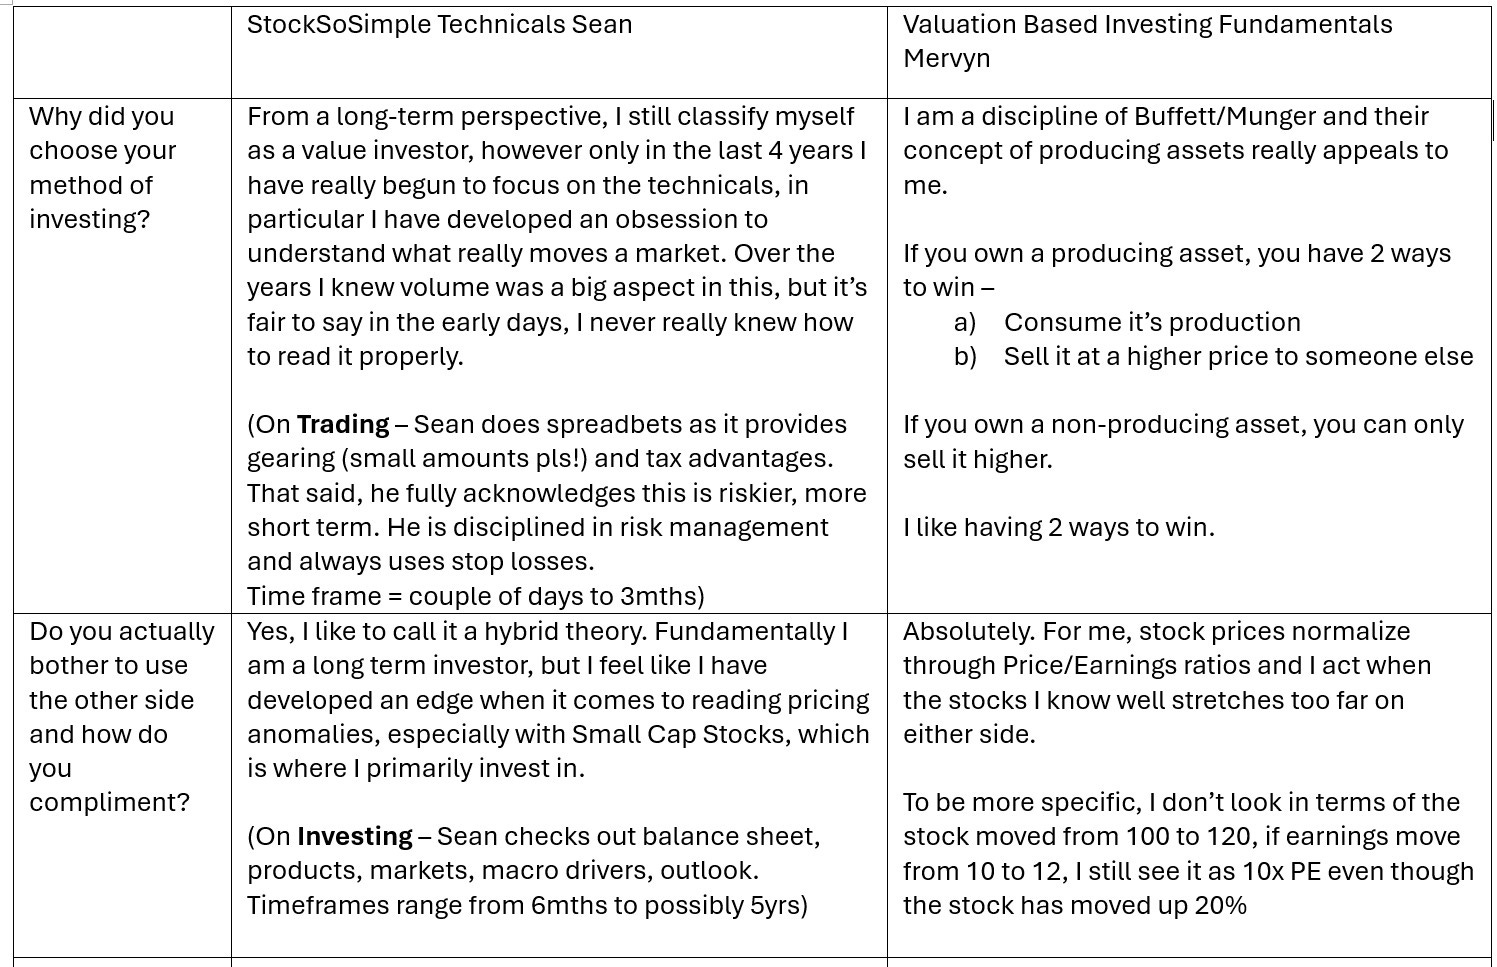
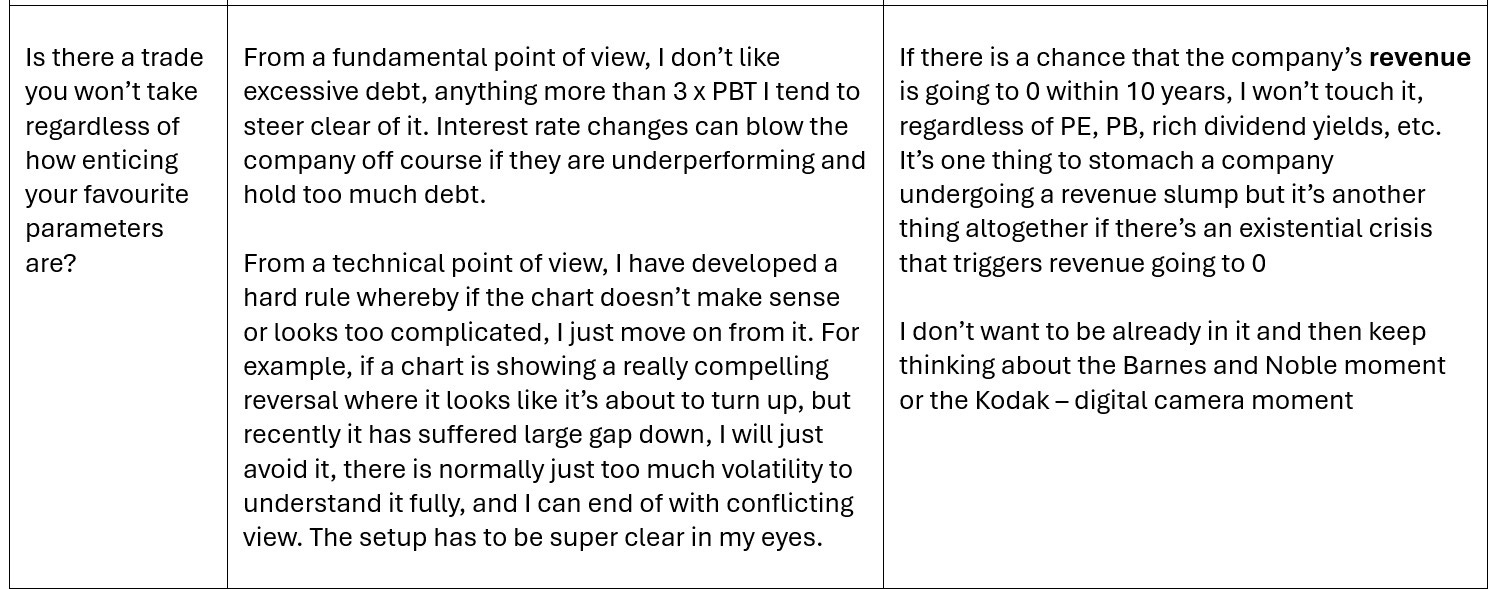
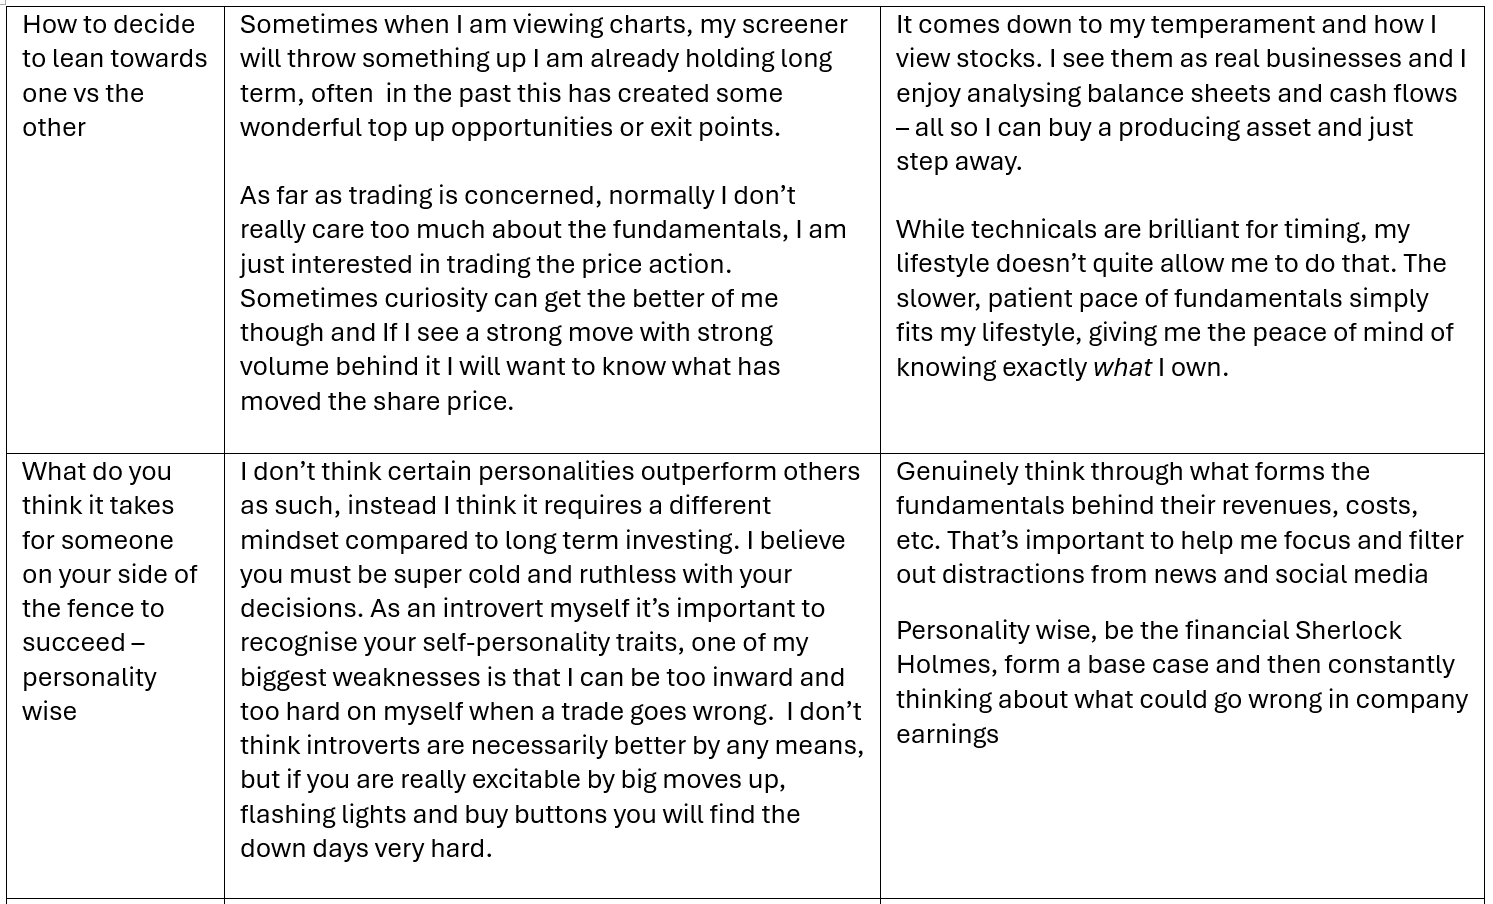
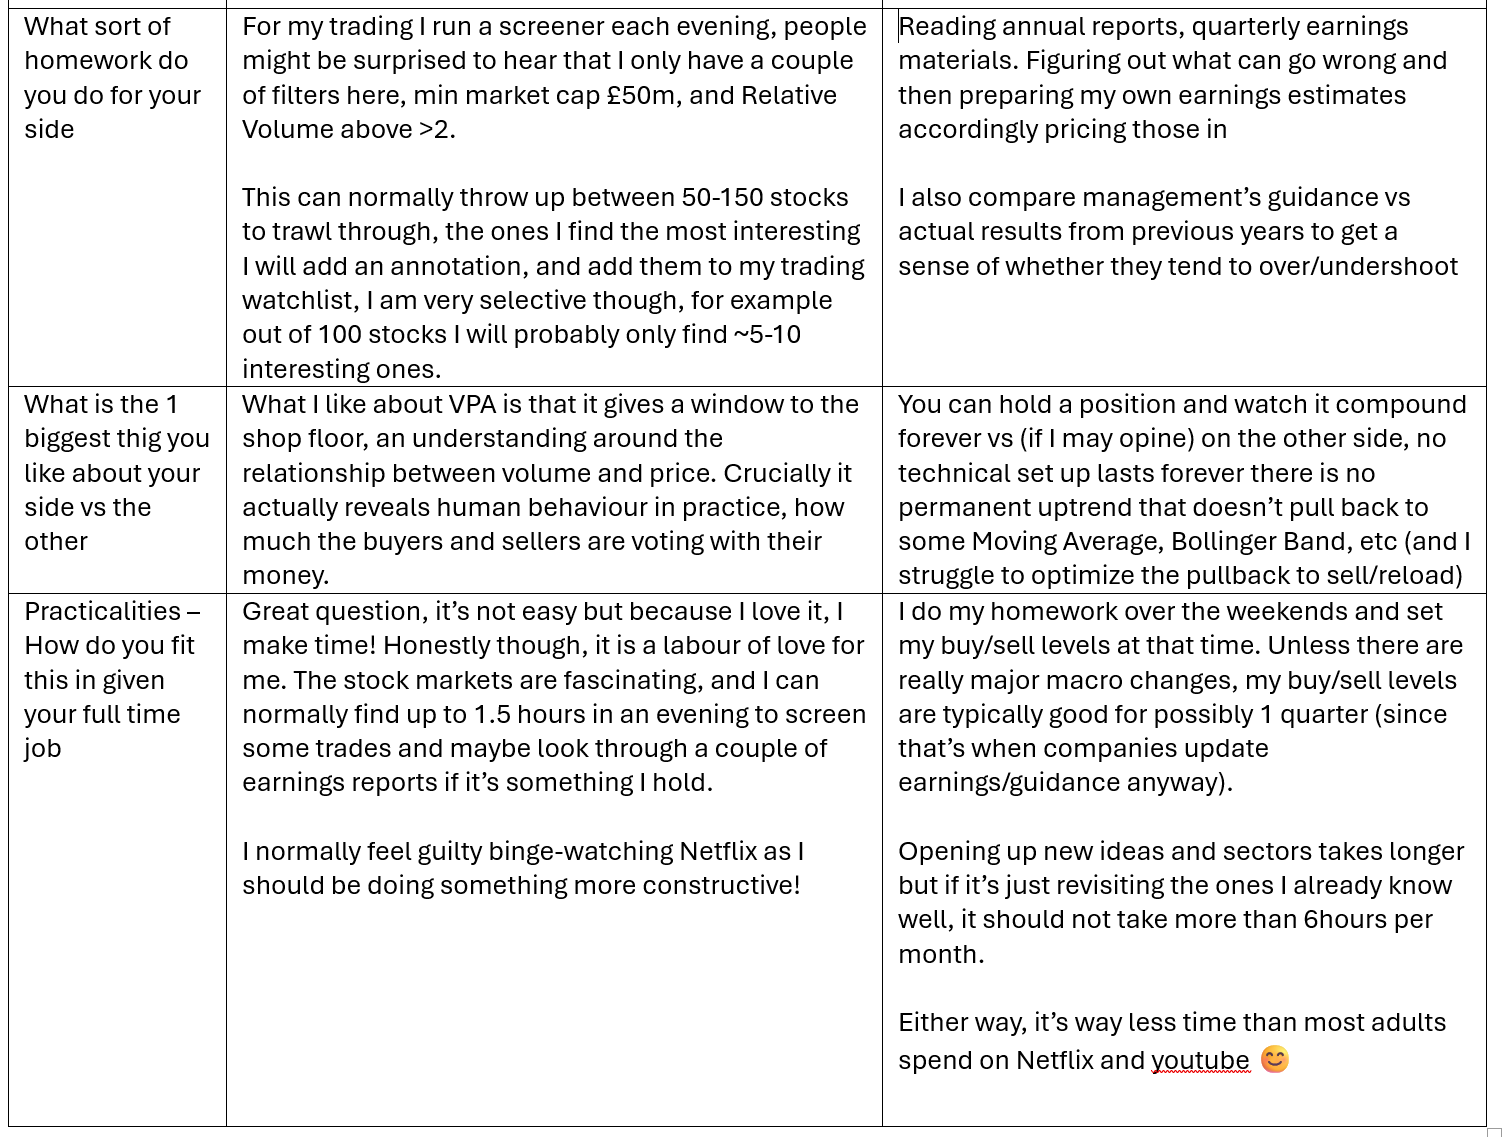
Meet Sean from StocksoSimple, who specialises in VPA (Volume/Price Analysis) and broadly represents the “technicals” side. And then there’s me, Mervyn from Valuation Based Investing (80% value and 20% momentum), standing in for the “fundamentals” camp.
From the outset, Sean and I want to say something clearly: we don’t see this as a fight.
Because this really doesn’t have to be either/or. Your boyfriend can be handsome AND rich. Maths and Literature can BOTH be useful. Just because you rate Steven Gerrard doesn’t mean you need to despise Man United (no matter how many times Fergie breaks your heart…). After all, if you’re already long Stock X, aren’t you happier if BOTH Warren Buffett AND Richard Dennis want to buy Stock X tomorrow?
That said, we understand that your personality and lifestyle means you naturally lean one way a little more (ideally without negativity towards the other side). Michael Jordan could play baseball AND basketball — but even he had to tilt more towards one.
We wrote this collaboration with two specific goals in mind:
For the Beginner: If you are new to investing, this interview will help you discover your natural “tilt” while keeping an open mind to the other side.
For the Intermediate: If you live strictly in one camp but want to steal one single skill from the other side to give yourself an edge, we’ll show you exactly where to start.
How did we get into it?
How did we pick our tilt?
From Mervyn to Sean -
Earnings Surprises - When a company does well and the stock sells off. In those situations, if I’m tempted to look at tape or technicals, where should I look?
There was an old quote from the Naked Trader that stuck with me years ago, Buy the News Sell the fact, I still think this is very true today, quite often the bigger players are using this positive news outlet to create liquidity, the larger players have already priced the news in, and the positive news creates a selling opportunity for them. It’s important to check where the price closed on the day, a wide spread candle closing near the lows with strong volume behind it, you know an institution is unloading into this.
High/Negative PE folks - I imagine AI/Tech are a sector where our styles would contrast the most – particularly money losing companies (the classic never made a profit, mgmt. projects 5yrs later, Revenue 10x to turn EBITDA +ve). These are considered non-producing assets in my area. I wouldn’t buy those but would you go long if the VPA suggests you should? And how do you convince yourself, it won’t go to 0?
This is where I turn cold from a trading point of view, I have no issue trading very exuberant stocks on sky high valuations. I don’t expect to hold it forever, I just want to ride a re-rating in price, then ditch it. Although I am consciously aware of trading around trading updates, stocks going ex-dividend, etc because if you don’t anticipate it, then the price swings can knock out your stop loss for the wrong reasons.
Backtest - How do you backtest? And how do you continuously check that the edge is still there? I’ll make up something elementary – for instance, when volume 5x 30day average, there’s 70% chance trend will continue and 30% it will mean revert. So how do you continuously check the odds are still 70/30?
First of all, which may come as a surprise I don’t actually carry out any purposeful backtesting, instead because I have made quite a few annotations on the my charts over time now, every time they come back on to my screener its quite easy to review them. Interestingly the win/loss ratio plays an important role here, and I do continually review my win/loss ratio. At the moments its around ~50% but as long as I run my winners and cut the losers short I do ok, yet even if you only had a 40% win rate A 1:2 R:R here puts you comfortably in profit. The key lesson here is that being wrong more than you are right is completely fine, what matters is the size of your wins versus the size of your losses
Confusing no news breakout? A stock breaks out on huge volume but there’s no news, no catalyst, no nothing. Pls walk through what you would do next and what would make you place a trade.
First of all, I try not to overthink it. Sometimes it’s strange when there is a big move on strong volume but no news, this can be a combination of traders, market makers and institutions opportunistically trying take the price to the next level.
There are 2 ways to answer this. Reversals, and breakouts
I tend to focus on a lot of reversal trades, because its clear to see a change in sentiment, but for this to work I find most of my most profitable trades at the edge of established trading ranges, I expect to enter at the bottom of a range and trade the price to top. My stop is usually set below the support area, and the top of the range should be at least 10% away from entry, ultimately I like to aim for a 1:3 Risk to reward ratio.
Even with a simple breakout from a resistance level, I want to see strong price action breaking out but it must have strong volume behind it. Before I place a trade, I work out what price level is likely least like to get hit, normally I will place a stop under a short-term support level. Once this is determined then its hard to set an target exit, I expect to ride the price momentum for as long as I can, trailing the stop up as the price increases.
Other asset classes - Because I’m using producing assets and I specialise in stocks, admittedly this takes me out of opportunities in a lot of asset classes (gold, oil, FX). I would imagine VPA has the potential to open opportunities in multi-asset classes and I recognize that is one key limitation for my style
I think it’s really important to stick to what you know, most investors and traders find their strategies only really work in certain cyclical conditions. Its not uncommon to experience FOMO when certain sectors are roaring up, but if you don’t understand them, then its probably best to avoid them.
Although VPA is something that you can apply to most financial instrument, and if you can apply it to the areas you are most knowledgeable on then you may see opportunities a little more clearer. If you are an expert on Banks, just apply simple Volume Prices Analysis to banking stocks. If oil and gold is your thing, then apply VPA to that. There is riches in niches.
From Sean to Mervyn
Mervyn I just want to say a massive thank you for this opportunity, it’s not often I get to sit down with real investors and bounce ideas around, and for me that can really unearth some value. Investing is fascinating and the only reason we have a market is because there is a contrast of opinions. It’s ok to form an opposing opinion, it gives clarity and listening to others helps see things from a different angle that you may have never seen.
Conclusions and Tangible Takeaways
Our (Sean and I) aspiration is that this article has persuaded the audience that both Fundamentals/Value and Technicals/Momentum camp can absolutely coexist and be complement each other.
If you’ve a beginner and wondering which style suits you better, do this sniff test -
You’ve just bought £1000 in a stock and it drops by 10% next week, if your natural reaction is to
Check if earnings have changed and if so by how much? you’re probably more tilted to Fundamentals
Pull up a stock chart to cross check vs your usual indictors and possibly re-read on either new indicators or on a different time frame, you’re probably more tilted to Technicals
If you’re in the fundamentals camp looking to add on 1 single technique from technicals
Focus on volume at key support and resistance levels and how price reacts. Volume is a leading indicator, confirming whether a price move is genuine. If volume doesn’t support the move, it may signal shifting sentiment. I look for unusually high volume, specifically when relative volume is more than twice the previous day’s average (>2).
And the other way round - If you’re in the technicals camp looking to study 1 single concept from fundamentals
Check that the company has been profitable for the past 5 yrs – that way you know at the very least that it’s a producing asset that’s worth something and that it’s not all hype (never forget the Tulip Mania!)
You’re also more likely to get dividends if there’s consistent profit
At the end of the day, adopting a tool from the “other side” requires leaving your ego at the door. No single side has a monopoly on good ideas that open-mindedness is exactly what takes your investing to the next level.
PS — This isn’t just an investing observation. Think about the classic political Party A vs B dynamic. Unless you’re on a reality TV show, very few things in life genuinely benefit from a mutually exclusive either/or relationship. The world is competitive enough as it is. It takes real energy to improve yourself and do the right thing. Why would you spend energy to make the other side look bad — rather than just being better yourself?
Or put another way, as investors, are we more interested in growing our portfolio – or checking someone else’s portfolio doesn’t grow? 😊
----------------------------------------------------------------------------------------------------------------------
A Quick Glossary of Terms Used in This Interview:
VPA (Volume/Price Analysis): A technical strategy that looks at the relationship between a stock’s price movement and its trading volume to determine if the big institutions are secretly buying or selling.
R:R (Risk-to-Reward Ratio): A metric traders use to compare potential loss versus potential gain. A 1:3 R:R means you are risking £1 to potentially make £3.
Stop Loss / Trailing Stop: [Assuming you’ve already bought the stock] An automatic order set with a broker to sell a stock if it reaches to a certain price, protecting you from massive losses. A trailing stop moves up automatically as the stock price climbs, locking in profits.
Wide Spread Candle: On a stock chart, a “candle” shows the price action for the day. A “wide spread” means there was a massive difference between the highest and lowest price that day, indicating high volatility and strong conviction from buyers or sellers.
Spread Betting & Leverage: A way to trade (tax-free in the UK) where you speculate on price movements without owning the underlying stock. Leverage means using a small amount of money to control a larger position, which multiplies both potential profits and potential losses.
EBITDA: A fundamental accounting metric (Earnings Before Interest, Taxes, Depreciation, and Amortization) used to evaluate a company’s core operating profitability.
PBT: Profit Before Tax
OTM Calls: Out-of-the-money call option – when the current price of the stock is above the strike price of the option. The option has no intrinsic value
Relative Volume: a technical indicator that compares a stock’s current trading volume to its normal, average trading volume over a specific past period (often 10, 30, or 60 days)
Regulatory Notice
This publication shares educational insights and personal investing frameworks only. It is not financial advice, investment recommendations, or guidance to buy/sell any asset.
I am not authorised or regulated by the FCA (UK) to provide advice.
Past performance is no guide to future results. All investing carries risk of capital loss. Always, always do your own research or consult qualified professionals suited to your circumstances.